Choosing the wrong performance rating scale is one of the most overlooked mistakes in HR. It leads to biased reviews, frustrated managers, and employees who have no real idea where they stand. This guide breaks down every major type of performance rating scale, shows real rubric examples, and gives you a clear framework to pick the one that actually fits your team.
What Is a Performance Rating Scale?
A performance rating scale is a structured framework that organizations use to evaluate how well employees perform against defined expectations. It standardizes the review process by giving managers a consistent set of criteria, levels, or descriptions to assess competencies, goal achievement, and overall job performance.
Think of it as the measurement tool behind every performance review. Without it, feedback becomes a collection of personal opinions rather than structured, comparable data. A well-designed scale transforms subjective impressions into objective, actionable insight that HR teams use to guide promotions, raises, coaching, and workforce planning.
Why Your Choice of Rating Scale Actually Matters
Most organizations pick a rating scale because it came bundled with their HR software. That is a mistake.
The scale you choose directly shapes the quality of data you collect. A scale with too few options flattens real performance differences. One that is too complex overwhelms managers and leads to inconsistent ratings across departments.
Here is what poor scale design costs you in practice:
Centrality bias — managers default to the middle rating for everyone, making it impossible to identify top or low performers
Leniency bias — positive-leaning scales push ratings toward the top, inflating scores across the board
Recency bias — vague scales make it easier for managers to rate based on the last few weeks rather than the full review period
Low spread — when all employees cluster around the same score, you lose the data needed for meaningful calibration
Common Types of Performance Rating Scales
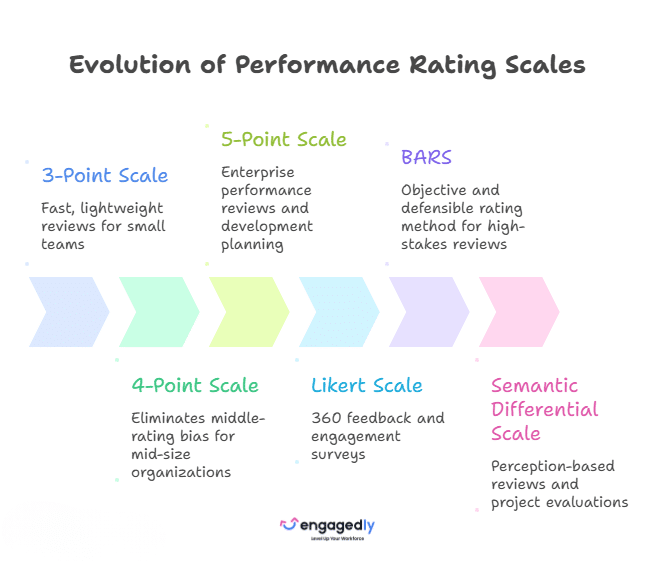
There is no single best scale. Each has trade-offs depending on your organization size, role complexity, and review goals. Here are the most widely used options.
3-Point Rating Scale
The 3-point scale is the simplest format and works well for fast-moving companies that want low-friction reviews. It typically uses three labels to describe performance levels. A standard version looks like this:
Does Not Meet Expectations
Meets Expectations
Exceeds Expectations
Additionally, the 3-point scale reduces manager confusion and speeds up the review process. The trade-off is low spread. With only three options, it is hard to distinguish between an employee who barely meets expectations and one who consistently hits targets. For that reason, many companies move away from it as their teams grow and performance data needs to support more nuanced compensation decisions.
Best for: Small teams, early-stage companies, or supplementary ratings on simple, binary competencies.
4-Point Rating Scale
More organizations now use the 4-point scale to address the centrality bias problem that plagues 3-point and 5-point scales. By eliminating a neutral middle option, it forces managers to make a clearer judgment call.
A typical 4-point scale looks like this:
Needs Development — performance consistently falls below role expectations
Occasionally Meets Expectations — performance is inconsistent; some expectations are met but not reliably
Consistently Meets Expectations — performance reliably meets role expectations across the review period
Exceeds Expectations — performance regularly goes beyond what the role requires
Because there is no middle score to retreat to, managers engage more honestly with where each employee actually stands. Research from CEB (now Gartner) found that removing the middle option from rating scales produced more accurate performance differentiation and stronger employee calibration outcomes.
Best for: Organizations dealing with centrality bias, mid-size teams, and reviews where compensation is tied to rating outcomes.
5-Point Rating Scale
The 5-point scale is the most commonly used format in performance management globally. It offers enough spread to capture real nuance while remaining simple enough for managers to use consistently. The UC Berkeley model is one well-known institutional example:
Exceptional — rare; reserved for outstanding contributors who set the standard
Exceeds Expectations — regularly performs above role requirements
Meets Expectations — solid, reliable performance across the review period
Needs Improvement — performance gaps are present and must be addressed
Unsatisfactory — performance is significantly below expectations; formal action may be required
The 5-point scale’s strength is its spread. It is detailed enough for complex roles but flexible enough to work across departments. The risk is centrality bias — managers often default to the middle rating (Meets Expectations) for nearly everyone, which compresses data and makes it hard to distinguish strong performers from average ones.
Best for: Larger organizations, roles with multiple competency dimensions, and reviews where development planning is a key output.
Likert Scale
The Likert scale measures agreement or sentiment rather than performance levels directly. It is most useful for evaluating soft skills, cultural alignment, or self-assessments. A standard 5-point Likert scale uses the following options:
Strongly Disagree
Disagree
Neutral
Agree
Strongly Agree
Likert scales work especially well for 360-degree feedback. For example, a peer reviewer might be asked, “This employee communicates expectations clearly to the team,” with the Likert options above as their response choices. The scale is symmetrical, balanced, and easy to interpret.
A 6-point or 7-point Likert removes the neutral option, similar to the logic behind a 4-point performance scale, pushing respondents toward a defined position.
Best for: 360-degree reviews, engagement surveys, self-assessment tools, and behavioral feedback.
Behaviorally Anchored Rating Scale (BARS)
BARS is the most sophisticated and objective performance rating format available. Each rating level uses specific, observable behavioral examples instead of abstract descriptors like ‘meets expectations. This significantly reduces the subjectivity that plagues most rating scales.
A BARS scale for a “Customer Communication” competency in a sales role might look like this:
5 — Outstanding — proactively follows up with all customers within 24 hours, tailors communication style to each client, and resolves complaints without escalation in 95%+ of cases
4 — Above Average — follows up with most customers within 48 hours and handles the majority of complaints independently
3 — Satisfactory — communicates with customers when prompted; occasionally misses follow-up windows
2 — Below Average — inconsistent follow-through; requires manager reminders to complete basic customer communications
1 — Unsatisfactory — regularly fails to respond to customers; complaints frequently escalate
However, BARS takes the most upfront investment to build because each scale must be custom-designed for each role and competency. But the output is far more defensible, fair, and useful than generic scales. It also reduces the legal risk associated with contested performance reviews.
Best for: Roles where specific behaviors can be defined, high-stakes performance reviews, compliance-driven industries, and organizations committed to reducing rating bias.
Semantic Differential Scale
The semantic differential scale presents two opposite descriptors at either end of a spectrum, with several unlabeled points in between. Respondents indicate their position along that spectrum.
For example: “How effective was this project outcome?”
This format is intuitive and gives respondents expressive freedom. It works well when measuring perceptions, attitudes, or outcomes that exist on a continuum rather than fitting neatly into defined categories. For standard performance reviews, it is less common but useful for project-based evaluations or post-review reflections.
Best for: Project outcome reviews, perception-based assessments, and qualitative feedback tools.
Real-World Examples of Each Scale (With Rubric Wording)
Understanding the structure of each rating scale is one thing. Seeing how they work in real review situations makes the differences much clearer.
Does Not Meet Expectations — regularly misses deadlines; requires manager intervention to prioritize tasks
Meets Expectations — completes most tasks on time; occasionally needs deadline reminders
Exceeds Expectations — consistently delivers ahead of schedule; proactively flags potential delays before they occur
4-Point Scale Example
Competency: Problem Solving
Needs Development — struggles to identify solutions independently; escalates most problems to management
Occasionally Meets Expectations — solves routine problems but needs guidance with complex or novel situations
Consistently Meets Expectations — independently resolves most issues within their scope; applies sound judgment
Exceeds Expectations — identifies root causes before they become problems; proposes process improvements that benefit the wider team
5-Point Scale Example
Competency: Collaboration
Exceptional — actively builds cross-functional relationships; recognized by peers as a catalyst for team performance
Exceeds Expectations — consistently supports teammates; often goes beyond role boundaries to contribute to team goals
Meets Expectations — works cooperatively within the team; fulfills collaborative responsibilities reliably
Needs Improvement — occasionally creates friction within the team; requires coaching on collaborative behaviors
Unsatisfactory — consistently disruptive to team dynamics; collaborative failures are recurring and impacting team output
Likert Scale Example
360-Degree Feedback Statement: “This employee actively listens during team discussions and incorporates feedback into their work.”
Strongly Disagree
Disagree
Neutral
Agree
Strongly Agree
BARS Example
See the Customer Communication example in the BARS section above. The same structure applies across any competency where teams can define behaviors precisely.
UC Berkeley and Harvard Models
Two university-developed scales are worth knowing because many enterprises adapt them directly.
Harvard’s Multi-Scale System covers four dimensions:
Overall performance uses a 5-point scale:
Leading
Strong
Solid
Building
Not Meeting Expectations
Goal achievement uses a 3-point scale:
Goal was met
Goal was partially met
Goal was not completed
Competency assessment uses a 4-point scale:
Advanced
Proficient
Developing
Does not demonstrate knowledge
Direct report effectiveness uses a 3-point scale:
Highly Effective
Effective
Requires Improvement
What makes the Harvard model useful is that it uses different scales for different measurement types rather than forcing everything into one format. That is worth considering when you design your own system.
How to Choose the Right Performance Rating Scale for Your Organization
There is no universal answer here, but there is a clear process. Work through these four steps and the right scale will become obvious.
Step 1 – Define What You’re Measuring
Performance reviews typically measure three types of things:
Outputs and goals — did the employee meet their OKRs or KPIs? A 3-point or goal-specific scale works well here.
Competencies and behaviors — does the employee demonstrate the skills the role requires? A BARS or 4-point descriptive scale is strongest here.
Overall performance — a summary judgment of the employee’s contribution. A 5-point scale gives the most flexibility for this type of holistic rating.
If you are measuring all three, consider using a multi-scale system like Harvard’s model rather than forcing every dimension into one format.
Step 2 – Decide How Much Nuance You Need
Ask your HR team one question: when managers review employees, how important is it to clearly distinguish between your top 20% and your middle 60%? If that distinction matters for compensation or succession planning, you need at least a 4-point scale. If you’re a small team doing development-focused reviews, a 3-point scale is fast and effective.
Step 3 – Consider Your Managers’ Calibration Tendencies
Look at your last round of review data. If ratings cluster in the middle, you have a centrality bias problem. A 4-point scale or forced distribution approach addresses this directly. If ratings skew high across the board, you have a leniency bias problem. Clearer behavioral anchors, like those in BARS, tend to correct this.
Step 4 – Test for Transparency and Fairness
Before rolling out any scale company-wide, test it:
Share the scale with a sample of employees and ask if they understand how each level is defined
Ask two managers to independently rate the same employee using the scale and compare results
Check whether the scale creates meaningful differences across your workforce or compresses everyone into two or three buckets
If the scale fails any of those three tests, revise it before launch. A scale that employees do not trust, or that managers apply inconsistently, produces data that is worse than no data at all.
Common Mistakes to Avoid When Using Rating Scales
Even well-designed scales fail when they’re implemented poorly. Here are the most common problems organizations run into.
Using a numeric-only scale without descriptors. Asking managers to rate leadership on a 1–10 scale with no further guidance is a recipe for inconsistency. A score of 7 from one manager might mean the same thing as a 5 from another. Always pair numeric scores with descriptive language.
Hiding the scale from employees. One of the most damaging things a company can do is claim they have abandoned performance ratings while continuing to use them internally for compensation decisions. Employees eventually find out, and the result is a credibility loss that takes years to recover from. Transparency is not optional.
Not training managers on the scale before using it. Rating scales require calibration. Without training, you get 50 managers with 50 different interpretations of what “meets expectations” means. Calibration sessions where managers discuss their ratings before finalizing them significantly improve consistency. Many organizations now run formal calibration meetings across departments to reduce rating inconsistencies and improve fairness across teams.
Selecting a scale based on what your software supports rather than what your team needs. Many HR platforms offer a default 5-point scale with generic labels. That default is a starting point, not a recommendation. Customize it or find a platform that lets you define your own rubric wording.
Treating all competencies the same. For example, a technical skill like “writes clean code” can be assessed with a fairly objective scale. A soft skill like “demonstrates leadership” is harder to pin down without behavioral anchors. Using the same scale format for both often means one of them is measured poorly. Use BARS for behaviorally complex competencies and simpler scales for quantifiable outputs.
Build a More Effective Performance Review Process
Performance rating scales shape how organizations evaluate performance, identify growth opportunities, and make critical talent decisions. But the scale itself is only one part of an effective performance management strategy.
Modern organizations are moving beyond static annual reviews toward more continuous systems that combine structured evaluations with real-time feedback, goal tracking, development planning, and workforce analytics. The goal is not just to rate employees more accurately, but to create clearer alignment, better coaching conversations, and stronger employee growth over time.
Platforms like Engagedly help HR teams connect performance reviews, OKRs, 360 feedback, continuous feedback, employee development, and talent analytics into one integrated experience. This allows organizations to build more transparent, data-driven, and scalable performance management programs without adding unnecessary complexity.
If you’re evaluating ways to modernize your performance review process, improve rating consistency, and support employee development more effectively, request a demo to explore how Engagedly can help.
Frequently Asked Questions
What is a performance rating scale?
A performance rating scale is a framework used to evaluate employee performance against predefined expectations, goals, competencies, or behaviors.
Organizations use rating scales to: Standardize performance reviews across teams Reduce subjectivity and manager bias Track employee progress over time Support promotion, compensation, and development decisions Generate consistent performance data for workforce planning A well-designed rating scale helps employees understand what good performance looks like and how they can improve.
What are the most common types of performance rating scales?
The most widely used performance rating scales include:
3-point scale – Simple categories such as Does Not Meet, Meets, and Exceeds Expectations 4-point scale – Removes the neutral middle option to reduce centrality bias 5-point scale – The most common format for performance reviews Likert scale – Measures agreement or perception, often used in 360-degree feedback Behaviorally Anchored Rating Scale (BARS) – Uses specific behavioral examples for each rating level Semantic differential scale – Measures performance or outcomes along a spectrum between opposite descriptors Each scale serves different purposes depending on organizational goals and review complexity.
Which performance rating scale is best for employee performance reviews?
The best rating scale depends on what your organization is trying to measure.
Generally: 5-point scales provide the best balance of simplicity and differentiation 4-point scales help reduce centrality bias by eliminating the middle option BARS scales provide the highest level of objectivity and consistency 3-point scales work well for small organizations or simple evaluations Organizations evaluating promotions, compensation, and succession planning often benefit from 4-point, 5-point, or BARS-based systems.
What is a 5-point performance rating scale?
A 5-point performance rating scale evaluates employees across five performance levels.
A common example is: Unsatisfactory Needs Improvement Meets Expectations Exceeds Expectations Exceptional Benefits of a 5-point scale include: Clear performance differentiation Easy manager adoption Strong support for development discussions Useful performance data for calibration and compensation decisions This remains the most commonly used rating scale in performance management.
What is a Behaviorally Anchored Rating Scale (BARS)?
A Behaviorally Anchored Rating Scale (BARS) evaluates employees using specific, observable workplace behaviors instead of broad performance labels.
For example, instead of rating communication as “Excellent,” BARS defines exactly what excellent communication looks like in practice. Benefits of BARS include: Reduced rating bias Greater consistency across managers Clearer employee expectations More defensible performance evaluations Better coaching and development conversations Because it requires custom behavioral definitions, BARS typically takes more time to implement than traditional scales.
What is centrality bias in performance reviews?
Centrality bias occurs when managers consistently rate employees near the middle of the scale regardless of actual performance differences.
Common causes include: Avoiding difficult conversations Lack of confidence in rating decisions Poorly defined performance criteria Inadequate manager training Organizations often reduce centrality bias by: Using 4-point rating scales Providing behavioral rating examples Running manager calibration sessions Training managers on evaluation standards
How can organizations reduce bias in performance ratings?
Organizations can improve rating accuracy by combining structured processes with manager training.
Best practices include: Using clearly defined rating criteria Implementing behavior-based scales such as BARS Conducting calibration meetings across departments Incorporating 360-degree feedback Training managers to recognize common rating biases Reviewing ratings for consistency before finalization The more objective the evaluation process, the more reliable the performance data becomes.
Should performance ratings be tied to compensation decisions?
Many organizations use performance ratings as one factor in compensation decisions, but ratings should not be the only factor considered.
Compensation decisions often include: Performance review outcomes Goal achievement Market pay benchmarks Internal equity considerations Critical skills and business impact Using multiple data points helps organizations make fairer and more transparent pay decisions.
Can different departments use different rating scales?
Yes. Many organizations use different scales for different evaluation purposes.
For example: A company-wide 5-point scale for overall performance BARS scales for competency assessments Goal completion scales for OKRs Likert scales for 360-degree feedback Using multiple scales allows organizations to measure different aspects of performance more accurately.
How often should employee performance ratings be conducted?
Most organizations conduct formal performance evaluations: Annually Semiannually Quarterly
However, modern performance management increasingly combines formal reviews with: Continuous feedback Monthly check-ins Goal progress conversations Development-focused coaching sessions
Regular feedback improves performance more effectively than relying solely on annual reviews.
What should employees do if they disagree with a performance rating?
Employees who disagree with a rating should seek clarification and discuss the evaluation constructively.
Recommended steps include: Reviewing the rating criteria Asking for specific examples supporting the rating Sharing relevant accomplishments or context Discussing development opportunities Creating a plan for future improvement A transparent review process should allow employees to understand how ratings were determined and what actions can improve future outcomes.
Srikant Chellappa is the Co-Founder and CEO at Engagedly and is a passionate entrepreneur and people leader. He is an author, producer/director of 6 feature films, a music album with his band Manchester Underground, and is the host of The People Strategy Leaders Podcast.


 Performance