


Your employee engagement survey results have just arrived but now what? Gone are the days when you could conduct a poll just to tick a to-do box and ignore the results or skim over the negative parts.
Whether positive or negative, employee engagement surveys offer a treasure trove of information that HR departments and management can use to better engage and motivate employees at all levels. To do so, you need to first correctly interpret the survey findings, of course.
The employee survey data gives you an identifying of the main areas to focus on, which is the first step in creating a successful employee engagement action plan. No company can be expected to respond with every bit of feedback. Instead, People Insight suggests utilizing the findings of your employee survey to highlight a few areas to improve – the things that are most important to your staff.
In this article, we will discuss exactly how to do this, and the various assumptions and biases one must be aware of when analyzing employee engagement survey results.
Why Analyze Employee Engagement Survey Results?
Employee surveys are a direct approach to learning what your employees think of your company, the issues they experience, and the changes your company can make. The effectiveness of these enhancements is determined by your ability to read and analyze employee survey findings. The best employee engagement survey softwares provide tools to make this process more actionable.
Unfortunately, the majority of organizational initiatives are ineffective. In reality, according to the data, just 25% of employees believe that their company takes highly efficient responses to the feedback they offer.
Taking the wrong action or disregarding (even unintentionally) employee input can have serious ramifications for your company. When employees feel that their opinions do not matter, engagement can suffer significantly. According to Gallup, highly engaged employees contribute to stronger productivity, profitability, and workplace culture. Employee disengagement, on the other hand, can have a detrimental influence on organizational performance. Do not fall victim to this. Make data-driven modifications based on the input you get and share the outcomes with your staff. You maintain open channels of communication by closing the feedback loop and demonstrating that employee voices are valued.
Also Read: How To Create A Good Employee Engagement Survey?
Types of Employee Engagement Survey Results
Staff opinions concerning issues impacting your organization such as bad attitudes, employee attrition, and lower productivity, are captured in several employee engagement surveys. Here are a few types of employee engagement survey results:
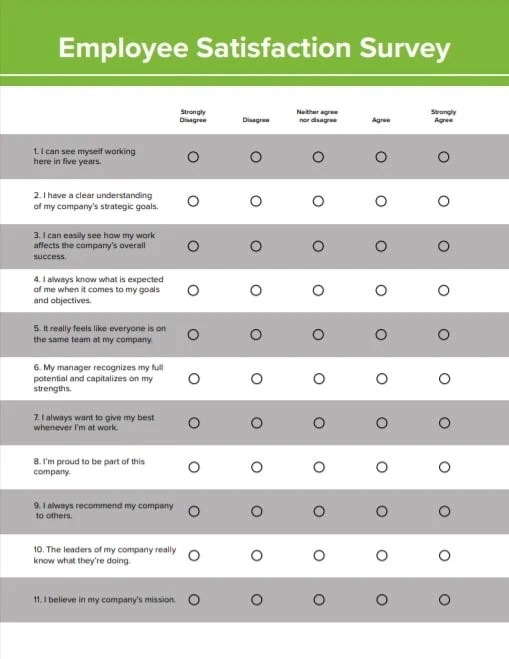
Employee Satisfaction Survey
Employee Satisfaction Surveys are useful for determining overall happiness as well as staff satisfaction following a specific change like a layoff, merger, or business relocation.
 Business Improvement Survey
Business Improvement Surveys might reveal difficulties you didn’t realize you had, such as managerial or training concerns. Such surveys can also raise staff morale by demonstrating that you respect their input.
360 Degree Feedback Survey
360 Degree Feedback statistics tell you and the employees how others see him and how he perceives himself, as well as offer ideas for growth. The survey also shows the employee that you value his previous work and acknowledge his talents and achievements.
Exit Interview Survey
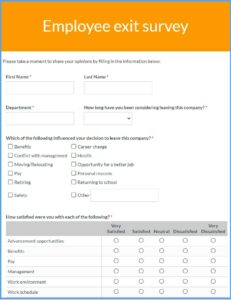
This sort of survey helps in figuring out why workers depart and how to minimize future attrition by making operational changes. This survey can also assist you in reversing a valuable employee’s choice to quit by revealing that the staff is inclined to remain provided you make certain modifications to his work demands, training, promotion possibilities, salary, or general working circumstances.
Also Read: All You Need to Know About Employee Engagement Surveys
Key Metrics and Indicators in Employee Engagement Survey Results
In employee engagement survey results, several key metrics and indicators provide insights into the overall health and satisfaction of the workforce. Some of the essential metrics include:
- Overall Employee Engagement Score: A composite score that reflects the overall level of engagement across the organization. It is often calculated based on responses to key survey questions. These metrics depend heavily on the quality of your employee engagement survey questions.
- Job Satisfaction: Measures employees’ contentment with their roles, responsibilities, and the work environment. It can be an indicator of overall morale and happiness at work.
- Employee Net Promoter Score (eNPS): Assesses employees’ likelihood to recommend their organization as a good place to work. It provides an indication of employee loyalty and advocacy.
- Communication Effectiveness: Evaluates how well information is communicated within the organization. It assesses the clarity, transparency, and accessibility of communication channels.
- Leadership Effectiveness: Measures employees’ perceptions of leadership, including trust in leadership, communication from leaders, and confidence in leadership decisions.
- Recognition and Rewards: Assesses whether employees feel adequately recognized for their contributions and if the rewards system is perceived as fair and motivating.
- Career Development Opportunities: Indicates employees’ satisfaction with opportunities for professional growth, skill development, and career advancement within the organization.
- Work-Life Balance: Measures how well employees feel their work and personal lives are balanced. It reflects the organization’s commitment to employee well-being.
- Team Collaboration: Assesses the effectiveness of teamwork and collaboration within the organization. It provides insights into team dynamics and cooperation.
- Employee Feedback and Performance Reviews: Gauges employees’ satisfaction with the feedback and performance evaluation processes, including the frequency and quality of feedback received.
- Employee Inclusion and Diversity: Assesses perceptions of inclusivity and diversity within the workplace, reflecting the organization’s commitment to creating an inclusive environment.
- Intent to Stay/Retention: Measures employees’ likelihood to stay with the organization. It can be an early indicator of potential turnover issues.
Analyzing these key metrics in employee engagement survey results helps organizations identify areas of strength and areas that require improvement, guiding strategic initiatives to enhance overall employee satisfaction and engagement.

How to Analyse Employee Engagement Survey Results?
It’s critical you act quickly when your staff survey has ended. This demonstrates that people’s voices have been heard and valued. Employee engagement survey results must be shared and implemented across the firm and among team members for maximum impact.
1. Quantify the information
Results that are quantified (numeric scores) are a clear and meaningful approach to conveying them. Everyone can recall numbers. This also facilitates data comparison.
For example, displaying the percentages of various respondents’ responses to a survey item might help us better grasp the general trend.
2. Dissecting the data
Everyone’s employment experience is different. By fragmenting your data by staff groups and demographics, you may gain a better understanding of the issues that various workgroups face. This will help to compare the performance of different teams and take some action where it is really needed.
3. Look for trends and patterns
Look for patterns in your survey data. What is significant to one individual may be meaningless to another. It’s striking when 80 percent of respondents indicate they’re unhappy with the overtime pay-off policy. Maybe not so much when a few employees want an additional short break during the day.
- Are the replies uniform throughout the company?
- Are there any distinctions between FTEs and hourly employees?
- What about experienced employees versus new hires?
These questions will assist you in identifying changes that will have the greatest impact.
4. Pay attention to qualitative replies as well
Don’t only focus on the figures. Make sure you pay equal attention to both quantitative and qualitative comments. These reactions are significant because they go deeper than quantitative (numerical) data. It’s what makes the narrative come alive.
Numeric responses without context can be inaccurate since they don’t account for other aspects. Motivations, cognitive processes, and attitudes may all be captured using a qualitative technique.
5. Trust your intuition
Don’t overlook your first-hand experience and instincts when conducting data analysis. You are also an important element of your company.
Consider whether the data makes sense in light of the company’s culture and conditions. While objective analysis is important, don’t disregard your instincts.
Look into any differences between your personal observation and the results. To learn more about the statistics, think about sending an open-ended follow-up survey or hosting a small focus group. This will assist you in grasping the larger picture.
6. Compare and contrast your survey findings
Benchmarking your performance can help you gain a better understanding of how your company is performing and discover opportunities for improvement.
There are three sorts of benchmarks to utilize when reviewing survey data: national, industrial, and internal benchmarks.
7. Set priorities for the changes you wish to make
It’s time to prioritize your results after you’ve reviewed your survey data. To begin, go over each item in the questionnaire and assign it to one of three categories:
- “Strong,”
- “Neutral,” or
- “Needs Work.”
Having a solid mix of improvements is also a good idea. Concentrate on both short-term successes (1 to 3 months) and long-term gains. This will demonstrate to your personnel that you are going to act and will enable you to take on greater tasks.
8. Visualize your information
Data visualization aids in capturing the attention of your staff and stakeholders. Our brains comprehend visual information more quickly and are less prone to mistake it. There are various sorts of graphics that may be used to represent survey data, such as pie charts, bar graphs, etc.
It’s time to address back once you’ve ‘digested’ the facts. Taking action is the most critical component of assessing your survey data. Your employees will become accustomed to the procedure and appreciate your candor if you report your survey answers on a regular basis. Even if you’re not happy with the outcomes, communicate them. Consider it a chance to encourage openness and staff participation in the solutions.
What methods of communication are most effective in your workplace? Does everyone use the same platform? If not, use different communication methods to spread the message.
Consider going through the adjustments and improvements you made in answer to the survey. Make a note of whether or not scores are growing over time. This demonstrates the company’s dedication to employee input.
Conclusion
Are you ready to start driving effective employee engagement at your organization? We’ve created a comprehensive white paper on exactly how you can do that. Download now.
Terrific numbers equal great employees. Numbers are entirely objective and will protect us from partiality and nepotism. A good score is crucial, especially for people in the service industry. Top scores can be used to create a survey. The findings of an employee engagement survey are one of several tools available to small company owners to help them improve interactions with their staff and develop their enterprises.

FAQs
What do engagement survey results mean?
Employee engagement survey results are the collected insights from workforce feedback that reveal how employees feel about their work, leaders, and workplace experience. These results combine quantitative metrics (like engagement scores or eNPS) with qualitative open-ended responses. Together, they help HR and managers understand what is working, what is underperforming, and where to focus corporate resources to improve communication, recognition, and retention.
How do you interpret engagement survey data?
Analyzing employee engagement survey results means turning raw feedback into clear, actionable priorities. A practical process includes:
Quantify the data: Review overall scores, approval percentages, and participation rates.
Segment the results: Break down data by department, team, tenure, or job level to find localized issues.
Identify patterns: Look for recurring trends across related questions.
Read open-ended comments: Use qualitative feedback to find the “why” behind the numbers.
Benchmark findings: Compare data against your past internal cycles or standard industry averages.
What metrics should an engagement survey track?
The most useful survey metrics are those that link employee sentiment with business risk and action. High-value data points to track include:
Overall employee engagement score and Employee Net Promoter Score (eNPS)
Job satisfaction and intent to stay (retention risk)
Leadership and communication effectiveness
Perceptions of recognition, rewards, and career development opportunities
What happens after an engagement survey?
The next step after receiving survey results is turning insights into visible, transparent action. A strong post-survey roadmap includes:
Share results openly: Present findings transparently to both leadership and employees.
Categorize outcomes: Group feedback into strengths, neutral zones, and high-risk areas.
Prioritize core issues: Pick two or three high-impact issues to address rather than trying to fix everything at once.
Build an action plan: Create near-term and long-term goals to solve those specific problems.
Close the loop: Regularly report back to the team on what changes are being made based on their feedback.
How do you act on employee engagement data?
Turning data into meaningful workplace improvement requires explicit structure, accountability, and regular follow-through. Best practices include:
Pinpointing priority gaps based on their direct impact on turnover and performance.
Assigning clear ownership to specific leaders or cross-functional teams for each action area.
Setting unambiguous timelines and success benchmarks.
Monitoring ongoing progress through smaller pulse surveys, targeted focus groups, or routine manager check-ins.